Wednesday, January 21, 2015

Good News for the Group!

A paper arc deformed such that a developable cone has formed (highlighted by the circle).  The flimsy paper cannot hold up the steel bolt, however, when crumpled up it can easily hold the bolt.  The key question is how and why we get strength from a collection of bends in the paper.
Today we have just been notified that we will receive a grant through the prestigious Young Investigator Research Program of the Air Force Office of Scientific Research!  This is fantastic news, not only because of the attention we will receive, but because it will allow us to do some really exciting research!  The proposal is centered on investigating how single and multiple bends in a thin film interact with one another, cause damage and/or lead to increased material strength in complex folded objects such as origami and crumpled materials.  The big details are in how the material of the film responds (stretches, yields, or fractures) as it takes on the desired structure.  The fundamental work we can now do will allow engineers to have a much better set of design guidelines when creating functional and lightweight origami based structures.

see the Air Force press release for more information.

Thursday, July 17, 2014

Nature 2014

Sun Cups
Fig. 1. Sun-Cups in my back yard.  Ruler gives the scale.
I had another great student from the NATURE program help me for a week this summer.  This year I was interested in creating artificial 'sun-cups' (see the picture).  Sun-cups are an interesting pattern that occurs when snow is exposed to radiated heat (usually the sun, but sometimes this happens near a camp fire).  Current models involve several details of how the snow melts, evapourates, and re-condenses.  The simple version is that a bump makes a shadow, and in the shade it is cooler.  The hot-cold asymmetry causes a pattern to arise.  I was most curious about how particle sizes (snow crystals) fit into the process.

Alyssa Weasel helped me try to create a lab version of this pattern using poly (methyl methacrylate) (otherwise known as plexiglass) particles.  She first used a spacer to make a controlled depth of particles (a few millimeters) on a clean glass substrate.  She then heated the polymer in a few different ways.  First, as a control, she heated the particles as one ordinarily cook an egg.  She simply set the polymer on a hot-stage and heated it above its melting point.  As one would expect, the particles melt and the result is a 'gob' of polymer.

Fig. 2.  Our beautiful setup.  Top is an upside down hot stage, bottom is several aluminum spacers.  In the middle is a glass slide with some plexi-glass particles on top.
Alyssa then took a similar sample and placed it on a metal spacer, underneath an upside-down hotplate (see figure 2).  Now several things are different, firstly heat is not conducted through the substrate but must reach the polymer through the air.  Secondly, radiative heating will also occur.  Alyssa measured the temperature of the sample with a thermocouple to have some idea how hot it was (this is not perfect in our simple set-up).

Fig. 3.  A 3D image of the polymer surface after heating.


If a sample was close to the oven, it would melt into a smooth mass on top of some un-melted particles.  This is easy to understand, if the top layer of particles melts completely the initially bumpy surface will be smoothed out by surface tension.  Ultimately any completely fluid interface (without outside influence like an electric field or something) will be smooth.  However, as she moved the samples further from the heat source, she did start to find a sun-cup like pattern (see 3D figure).  Not bad for a week of work!

Obviously there is a lot going on in this simple system, and the image of figure 3 is not very good characterization.  We have imaged different times and temperatures, but they do not render as well as this one (a relatively small perturbation).  We are confident in the formation of the bumps, but need to do much more to actually characterize the system.  We are not going to claim that the bumps we see have anything to do with the sun-cups formed in snow.  But it does make the point that there is some fun to be had with the polymer particles!

Monday, October 28, 2013

Cylinder Number 4


As luck would have it my pickup (1998 F-150 4.6L V8) decided to sputter violently as I brought my daughters to soccer the other night.  When we sputtered home, a quick check of the engine code confirmed my fear: Cylinder 4 was mad at me!  The reason I was worried, is that for an f-150 of this age the problem was likely that the air intake gasket has been eroded by the radiator fluid.  The erosion causes  holes to form and presto you get radiator fluid leaking into your cylinder 4 sparkplug.  As it turns out, nobody at ford was too interested in corrosion when they started making aluminum cylinder blocks. Yay Ford!
 
Figure 1.  Corrsion damage to old gasket and air intake plenum.  Note the grey RTV sealant from last time I fixed this.  It seems to last about 5 years.  White deposits are the corrosion, dark spots on the aluminum are pitting.
Well, after a few weekends (I get a lot of help from my kids so this takes longer than it might elsewhere) I managed to get things down to the block (see the image) confirming the problem.  The corrosion deposits between the rigid plastic and soft elastic part of the gasket slowly grow and push the two parts apart.  Concurrently with this process, the aluminum is being pitted by the corrosion.  Yuck!  A new gasket is not enough, the holes in the block must be fixed.

Figure 2.  New gasket sitting on the block.  RTV to fix the pitting.  Hurrah! fixed truck.
If I had a nice milling machine, I could (in principle) mill down the top of the block until the pitting was once again smooth.  Even if I were good enough to do this, it would be much more work to get the block out.  As fall was approaching at this point, I needed a quicker fix.  Never fear, polymers to the rescue (see figure 2).  With some high temperature RTV sealant you can fill the holes, plop on the new gasket bolt everything together and allow the RTV to cure.  Presto, fixed engine!  Is there nothing a good polymer can’t fix?

Critical Strain for Permanent Deformation in Thin Polystyrene Films

By Bekele J. Gurmessa

There is no doubt that polymers are an integral part of our daily life. If you drive a car, go to a food court or get groceries you will certainly come across products made from polymers. Polystyrene is a common polymer that you might encounter, and it is therefore a common focus of material scientists.

In our increasing desire to miniaturize functional devices the thickness of polymer films are being driven down towards the characteristic length scale of an unperturbed molecule. Surprisingly, researchers have revealed that unusual deviations of physical properties from their bulk values emerge as confinement increases (film thickness decreases). Namely, changes in glass transition temperatures, inter-chain entanglement densities, elasticity (Young’s modulus), and aging rates have been observed. Despite many careful experiments there is still a lack of consensus regarding the origin of these deviations. Some researchers even wonder if the techniques used to make the glassy polystyrene films (spin-coating, flow coating, etc) or handling procedure during an experiment may be partly responsible.

When a material is subjected to mechanical strain, it inevitably deforms (undergoes a change of shape). The deformation could be elastic - the material returns to its initial shape upon the removal of the applied stress (force per unit area) or the deformation could be plastic – the material does not return to its initial shape. In order to study deformation with a large piece material (a bulk sample) it is easy to use well established tensile tests. In a typical tensile test a large piece of polystyrene is clamped at both ends and pulled as the tension is monitored up to the point of failure. One of the many useful features of the stress-strain data generated in a tensile test is a simple indication of the yield point – the point at which the behavior switches from purely elastic to plastic. This method works well for bulk materials, but it would be incredibly difficult to repeat the test with very thin polystyrene films due to their relative fragility. Therefore the basic question remains open; when does thin film begin to deform plastically?

We have recently investigated the onset of plasticity in thin polystyrene films by making use of a delamination-buckling surface instability. Surface instabilities occur in a variety of phenomena, in lengthscales varying from nanometers in thin films to kilometers for tectonic plates. One of the most notable surface instabilities studied is delamination-buckling. When a thin polymer film bound initially to a stress free elastic substrate (see Fig. 1 top) is subjected to a compressive uniaxial stress, the film will initially be compressed in-plane and remain flat. However, as compression increases it will buckle out of plane in a repetitive sinusoidal pattern known as surface wrinkling (see Fig 1 bottom left). Increasing the applied stress further may cause the film to peel away from the substrate, resulting in delamination (see Fig. 1 bottom right). If we look at both the wrinkling and delamination, they both cause bending the thin polystyrene film to bend.


Figure 1.  General schematics of wrinkle-delamination of a thin polystyrene film bound to a soft elastic foundation of polydimethylsiloxane (PDMS).  Various quantities are labelled on the diagram.


To keep it simple lets stick to the delamination-buckling mode only for now. The delamination-buckling of thin films refers to a buckled film when it is partly debonded from the substrate. The stress at which delmaination occurs is dictated by the strength of adhesion between the film and the substrate as well as the balance of the mechanical strain energy stored in the film. Classical beam bending theory allows the strain of the bent region at the crest of the delamination to be determined. Concisely, it is the product of curvature (the second derivative of the deflection of the neutral axis from a flat state) and thickness of the film. So in the end, just looking at the delamination shape gives us a measurement of the strain the surface of the film feels.


Now our question was: does a thin film initially bent and then returned to a flat state store an irreversible residual stress? If we had a stress measurement in the bend, then we could create the same stress/strain data that is produced in the bulk and analyze the deformation in the same way. The problem here is that we don’t have a direct measurement of stress that works on such thin films. However, we just want to see if (and when) a film begins to be irreversibly deformed. So why not just look?

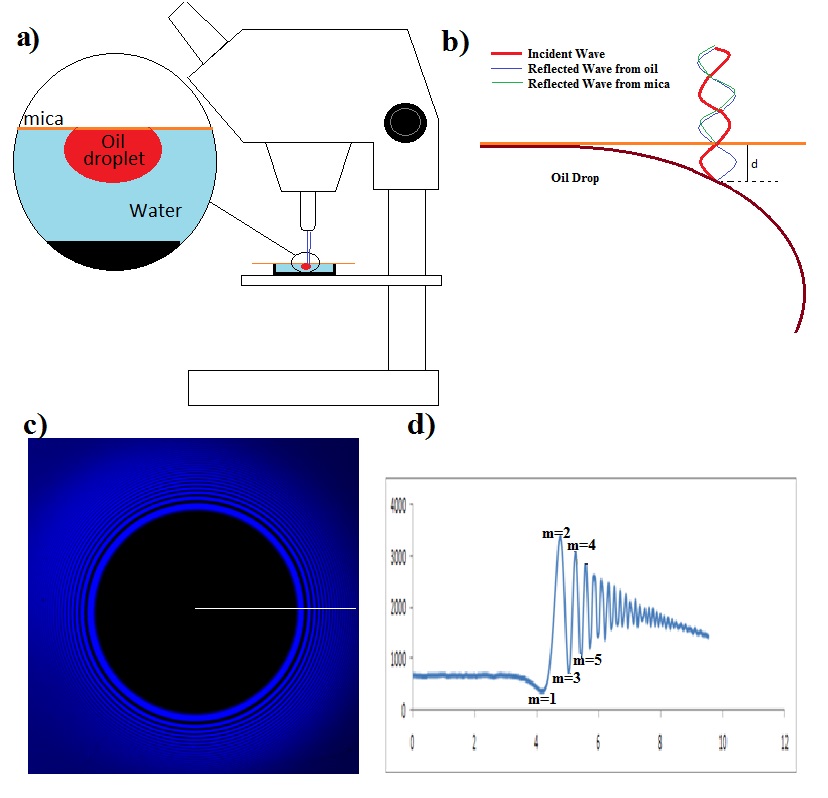
Figure 2. A confocal image of a typical delamination

This is the essence of the measurement that we have created. We take a thin film attached to a soft rubber substrate apply a compression to the rubber which results in a bent polystyrene film (a delamination as in Fig. 2). Because we measure the shape of the delmaination we know the strain the film was subject to all points along the delamination. We then remove the applied stress, returning the film to its initially flat state. Then we use high resolution microscopy techniques such as Laser Scanning Confocal Microscopy (LSCM) or Atomic Force Microscopy (AFM) to examine a bend for damage (Fig. 3)! Once damage is located, we have a strain value associated with it.  For example, the image of figure 2 is a 299 nm thick film in the delaminated state.  Figure 3 shows the same film after a few minutes of annealing (which causes the damage to stand out in the confocal microscope image).

Figure3. The same film annealed for ~10 min.
Most importantly, the minimum amount of strain (critical strain) required for the irreversible
deformation of the thin polystyrene film (the strain at the tip of Fig. 2c) has been quantified. According to our measurement the amount of this strain is incredibly small (of the order of 0.1%) when compared to the bulk measurement reported in literature for polystyrene (2%) nearly forty years ago by Argon in 1968. In addition to the small value of the critical surface strain, our measurements show that critical strain increases for film thickness less than 100nm. For detailed information about this work, please refer to our recent paper at (http://prl.aps.org/abstract/PRL/v110/i7/e074301).

Wednesday, June 5, 2013

Calculating the distance between two surfaces using Newton’s rings

By Damith Rozairo


Newton’s rings are formed by the interference of light beams reflected from two different surfaces. The phenomena is named after Isaac Newton who studied them in 1717, where he noted an interesting ‘bull’s eye’ pattern when he placed a curved piece of glass on a flat piece of glass.  The ‘bull’s eye’ is an interference pattern, formed due to the wave nature of light.  Below we describe how Newton’s rings can be used as a simple method to measure the shape of soft spheres.

To understand the details, let us begin with a bit of ‘light and waves’ background.  Light (or any wave) creates constructive interference (bright spots) when two waves are in phase and destructive interference (dark spots) when the waves are out of phase. If two waves are in phase, it means that the two waves are in synchronization; both waves have their peaks and valleys at the same location.  Out of phase means that the peaks of one wave are at the same location as the valleys of another.  A wavelength is the distance over which the shape of the wave starts to repeat.  For example, the distance between two nearby peaks in a sine function is a wavelength. Waves also travel at different speeds in different media.  For example light waves travel faster through air than through water and glass.  We can also define a unitless number, the index of refraction (n).  It is a measure of how fast a certain wave travels through a medium relative to the same wave traveling in a vacuum. Although we often treat this number as a constant, the index of refraction often depends on the wavelength used.
 
Figure 1.  Geometry of the experiment. (a) shows an oil drop under a microscope that is to be examined.  (b) gives a schematic close-up side view of the droplet.  (c) shows the actual interference picture observed (note the light and dark fringes moving out from the center contact patch (the black circle).  (d) a radial average of the interferogram.


In our experiments we look at oil drops pushed against a thin slice of transparent mica using a confocal microscope (Fig 1a). The microscope uses a laser light beam, which can reflect off of any surface being observed.  Our objective is to figure out the distance, d, between the mica surface and the drop surface using the interference pattern (Fig 1b). Note that there are two reflected waves, one from the mica surface and the other from the surface of the oil drop. These two reflected waves constructively interfere to form bright rings and destructively interfere to form dark rings. 
In Fig 1c note that the outer rings are more closely packed than the inner rings, this is because the drop surface is curving away from mica surface more rapidly the further you get from the contact patch (dark central region).

Figure 2.  Bragg scattering geometry.
The wave reflected from the drop surface, has to travel further than the wave reflecting off of mica surface. Calculating this distance can be simplified by using the geometry usually associated with Bragg’s law (Fig 2).  Consider a line between points a and c created at 90o to the incident rays, where c is the point the first ray reflects from the topmost surface.  If b is the point the second ray reflects from the second surface, then ab is the extra distance the 2nd wave has to travel relative to the 1st wave.  Considering the symmetry after the reflection, the total difference in distance traveled by ray 2 is 2*ab. Using a little bit of trigonometry, we see that Sinθ = ab/d, or
ab = d*sinθ
In short, this means that the first dark ring indicates that the second ray has traveled a difference of half of the wavelength further than the first ray, therefore 1/2λ = 2d* sinθ.  In our experiment the incident angle θ is equal to 90o, so 1/2λ = 2d and d = λ/4.  

A final detail that is important in our experiment is that the second ray travels through a fluid, and we need to take into account the index of refraction of water (n) which changes the effective path-length. Ultimately, d = λ/4n. The first bright ring is due to displacement of exactly one wavelength, second dark is due to 1.5 wavelength displacement, so on and so on.

Bright/Dark
m
d = mλ/2n
Dark
0.5
λ/4n
Bright
1
λ/2n
Dark
1.5
3λ/4n
Bright
2
λ/n
Dark
2.5
5λ/4n

In closing, if you know the wavelength of the light source and the refractive index of the medium in between the two surfaces, you can calculate the distance between the two surfaces.