Wednesday, June 5, 2013

Calculating the distance between two surfaces using Newton’s rings

By Damith Rozairo


Newton’s rings are formed by the interference of light beams reflected from two different surfaces. The phenomena is named after Isaac Newton who studied them in 1717, where he noted an interesting ‘bull’s eye’ pattern when he placed a curved piece of glass on a flat piece of glass.  The ‘bull’s eye’ is an interference pattern, formed due to the wave nature of light.  Below we describe how Newton’s rings can be used as a simple method to measure the shape of soft spheres.

To understand the details, let us begin with a bit of ‘light and waves’ background.  Light (or any wave) creates constructive interference (bright spots) when two waves are in phase and destructive interference (dark spots) when the waves are out of phase. If two waves are in phase, it means that the two waves are in synchronization; both waves have their peaks and valleys at the same location.  Out of phase means that the peaks of one wave are at the same location as the valleys of another.  A wavelength is the distance over which the shape of the wave starts to repeat.  For example, the distance between two nearby peaks in a sine function is a wavelength. Waves also travel at different speeds in different media.  For example light waves travel faster through air than through water and glass.  We can also define a unitless number, the index of refraction (n).  It is a measure of how fast a certain wave travels through a medium relative to the same wave traveling in a vacuum. Although we often treat this number as a constant, the index of refraction often depends on the wavelength used.
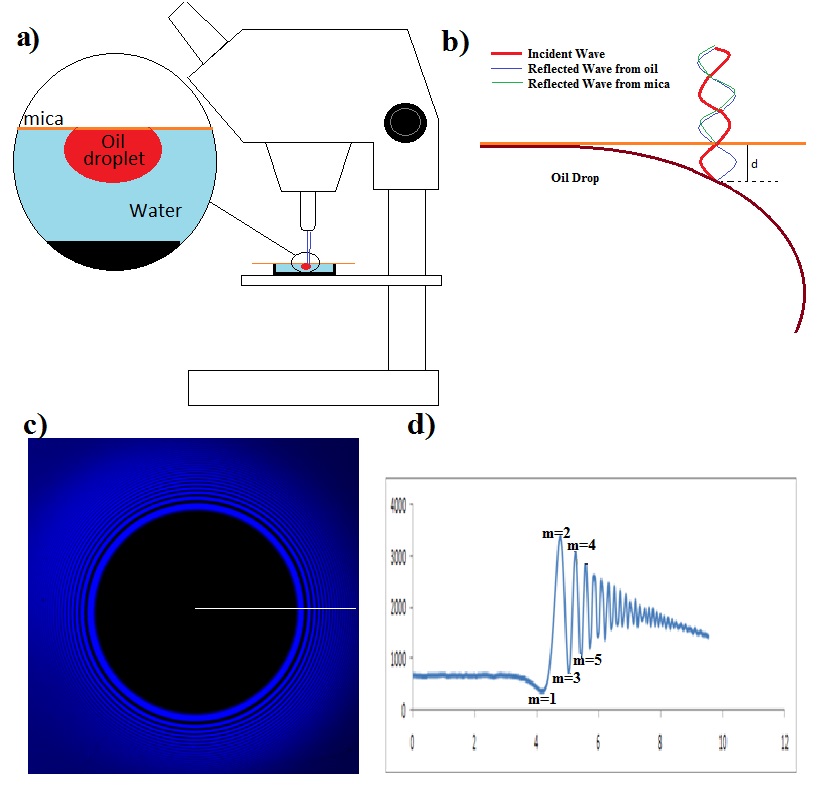
 
Figure 1.  Geometry of the experiment. (a) shows an oil drop under a microscope that is to be examined.  (b) gives a schematic close-up side view of the droplet.  (c) shows the actual interference picture observed (note the light and dark fringes moving out from the center contact patch (the black circle).  (d) a radial average of the interferogram.


In our experiments we look at oil drops pushed against a thin slice of transparent mica using a confocal microscope (Fig 1a). The microscope uses a laser light beam, which can reflect off of any surface being observed.  Our objective is to figure out the distance, d, between the mica surface and the drop surface using the interference pattern (Fig 1b). Note that there are two reflected waves, one from the mica surface and the other from the surface of the oil drop. These two reflected waves constructively interfere to form bright rings and destructively interfere to form dark rings. 
In Fig 1c note that the outer rings are more closely packed than the inner rings, this is because the drop surface is curving away from mica surface more rapidly the further you get from the contact patch (dark central region).

Figure 2.  Bragg scattering geometry.
The wave reflected from the drop surface, has to travel further than the wave reflecting off of mica surface. Calculating this distance can be simplified by using the geometry usually associated with Bragg’s law (Fig 2).  Consider a line between points a and c created at 90o to the incident rays, where c is the point the first ray reflects from the topmost surface.  If b is the point the second ray reflects from the second surface, then ab is the extra distance the 2nd wave has to travel relative to the 1st wave.  Considering the symmetry after the reflection, the total difference in distance traveled by ray 2 is 2*ab. Using a little bit of trigonometry, we see that Sinθ = ab/d, or
ab = d*sinθ
In short, this means that the first dark ring indicates that the second ray has traveled a difference of half of the wavelength further than the first ray, therefore 1/2λ = 2d* sinθ.  In our experiment the incident angle θ is equal to 90o, so 1/2λ = 2d and d = λ/4.  

A final detail that is important in our experiment is that the second ray travels through a fluid, and we need to take into account the index of refraction of water (n) which changes the effective path-length. Ultimately, d = λ/4n. The first bright ring is due to displacement of exactly one wavelength, second dark is due to 1.5 wavelength displacement, so on and so on.

Bright/Dark
m
d = mλ/2n
Dark
0.5
λ/4n
Bright
1
λ/2n
Dark
1.5
3λ/4n
Bright
2
λ/n
Dark
2.5
5λ/4n

In closing, if you know the wavelength of the light source and the refractive index of the medium in between the two surfaces, you can calculate the distance between the two surfaces.


Monday, September 10, 2012

I probably should have posted this earlier, but if you are in downtown fargo tomorrow with nothing to do...

Wednesday, August 15, 2012

Weekend Fun


The fuel pump went on my truck last week (a 1998 F150 4.6L V8).  So I had to drop the tank and install a new pump.  The pump failed because it relies on rubber components in order to maintain pressure in the fuel lines.  This might sound surprising; the pump in this vehicle is located inside the gas tank where we might expect it to be relatively protected.  The failure here falls under the mysterious category of ‘ageing’.  It is not always clear what happens to the elastomer exposed to gasoline, but the result is clear.  The stress eventually leads to fracture, and failure of the component.  Add it to the list of other good problems in polymer science!

Saturday, July 21, 2012

Fun With Cornstarch


Motivated by a recent NPR story (http://www.npr.org/2011/03/05/134268980/could-cornstarch-have-plugged-bps-oil-well ), Evan St. Claire and Ross Belgarde, two NATURE (http://www.ndepscor.nodak.edu/NATURE/index.html ) students  and I decided to explore the physics of shear thickening fluids.  The hypothesis proposed in the NPR story, was that a shear thickening fluid such as cornstarch and water could have been used to plug the flow of an oil spill (such as the recent BP oil well disaster).  Our thoughts were that this was a bit of a pipe dream; we didn’t believe that the properties of the shear thickening fluid would remain unchanged when mixed with crude oil.

As we didn’t have a cup of crude oil available in the lab, we decided to use dish soap as a substitute.  We reasoned that dish soap had some of the slippery, complex characteristics of oil that we wished to mimic.  Our experiment involved a home build vibration setup modeled after Merkt et al. (see http://prl.aps.org/abstract/PRL/v92/i18/e184501 ).  

Ross and Evan found that mixtures of cornstarch and water of mass ratios of about 0.75 would always show interesting ‘tower’ formation when driven at about 100 Hz (see the video’s from the Merkt paper http://www.youtube.com/watch?v=DrcShENMaoI ).  Remarkably, the addition of a few grams of dish soap completely killed the behaviour.  Our belief was that the soap caused a change in the fundamental fluid behaviour of the mixture.  To check, we used a cone and plate rheometer and measured the viscosity of all mixtures (shown in the figure).  This device measures the stress transmitted by a fluid from one rotating plate to another as a function of the ‘speed’ of rotation (the strain rate).  This allows us to measure the viscosity of each fluid (again see the figure).

Figure 1.  A cone and plate rheometer.  Our cornstarch is the  white goop in the middle of the two stainless steel rods.
The pure cornstarch and water mixture slows a clear shear thickening behaviour (upward curve as a function of strain rate).  In fact, it became so viscous that it began to slip along the plates just as a solid would.  For comparison we used a very low weight ratio cornstarch water solution (effectively water) which gives a very low and fairly flat curve.  We would expect that a purely Newtonian fluid would show no shear rate dependence.  When soap was added to the formerly shear thickening solution its behaviour completely changed.  Its viscosity dropped, but more importantly its slope changed from positive to negative – it changed from shear thickening to shear thinning!  Only at much higher strain rates did it start to recover shear thickening behaviour.  


Figure 2.  Viscosity as a function of strain rate for all our mixtures.  Note the shear thickening data cuts off below 1 Hz due to slip, and the dilute solution cuts off below 1 Hz as it drains out of the gap too quickly in this range.
We concluded that it is not obvious that a shear thickening fluid would be able to plug a broken oil well.  While our mixture does not necessarily mimic the actual well conditions, it does show how much the viscosity of the shear thickening mixture can change with the addition of a small amount of a third fluid.  To settle the oil well question our experiments would have to be conducted on the exact materials and the same speeds that would be present in the oil well.


Saturday, March 17, 2012

Aspiration of a Block Copolymer Emulsion Droplet

In this movie we see an oil droplet (in water) that is loaded with a surfactant being drawn into a thin micropipette.  In particular we use poly ethylene oxide - b - poly styrene as a surfactant, and toluene as the oil.  As the drop is drawn into the pipette, its surface area changes and with a measurement of the pressure applied by the pipette a force - surface area curve can be constructed.  Remember your first year physics - a force vs distance graph will get you a spring constant!  In other words, we are measuring the surface modulus of the droplet.  We hope that fooling around with the surfactant molecule concentration etc. will lead us to a better understanding of the molecular details of the interface.